Direct-to-consumer unit economics got weird because the old growth math assumed three things that no longer stay true for long.
Media would keep finding cheap buyers. First orders would carry enough margin to buy the next buyer. Returning customers would arrive often enough to clean up the payback period.
That was never a law. It was a market condition.
Now the healthier question is not "Can we scale the channel?" It is "Can the business explain the margin after the channel starts scaling?"
Triple Whale's 2025 Ecommerce Benchmarks Report describes a paid-media environment where CPMs and CPAs keep pressuring ecommerce performance, category fit matters more than platform preference, and AI search is becoming a new discovery surface. Klaviyo's 2026 email benchmarks are based on more than 183,000 customers, which is a useful reminder that owned-channel performance now needs to be managed like a core growth system, not an email afterthought.
The shift is practical. A DTC brand that cannot earn a useful second purchase, protect contribution margin, and compare channels beyond platform-reported return on ad spend is not scaling. It is renting momentum.
The modern DTC problem is not only that acquisition costs more. It is that weak retention and fuzzy measurement make expensive acquisition look better than it is.
The first-order trap
Most DTC teams still talk about growth from the first order backward.
What did Meta report? What was the blended customer acquisition cost? How did paid search perform? Which creative won? What did conversion rate do after the landing-page test?
Those are useful questions. They are not enough.
The first order has to carry the cost of traffic, payment fees, discounts, shipping, returns, support, fulfillment mistakes, and the creative production required to get the next order. If the team only sees revenue, average order value, and platform return on ad spend, the business can look healthy while cash gets thinner.
That is why unit economics need a margin view before a channel view.
| Signal | Weak version | Stronger version |
|---|---|---|
| Customer acquisition cost | Platform cost per new customer | Blended paid cost plus creative and agency load |
| First order | Revenue or gross sales | Contribution margin after shipping, fees, discounts, and returns |
| Lifetime value | Projected best-case lifetime value | Realized cohort value by order window |
| Retention | Email revenue total | Repeat purchase timing, replenishment rate, and segment behavior |
| Measurement | Platform-reported return on ad spend | Triangulated view across platform data, analytics, cohorts, and holdouts |
The discipline is simple, but not always comfortable. Do not let first-order revenue hide bad payback.

DTC acquisition should sort useful customers from expensive activity before the team increases spend.
This connects directly to conversion tracking before channel spend. If the business has not defined what a useful customer is, the channel will optimize toward the easiest event it can see.
LTV:CAC needs reality
Lifetime value to customer acquisition cost ratio still matters. The problem is how casually it gets calculated.
A projected lifetime value curve is not the same thing as a realized cohort. A brand can tell itself it has a 4:1 lifetime value to customer acquisition cost ratio because a small group of loyal customers reorder often. The next cohort may behave differently when acquired through a discount-heavy campaign, creator code, marketplace push, or seasonal spike.
For many DTC brands, a healthier operating model separates three views:
- First-order payback. How much margin is left after the first order?
- Second-order timing. How quickly does the customer return, and for what?
- Cohort quality. Which acquisition sources produce customers who behave well after the promotion is gone?
That last piece matters because not every customer is equally useful. A buyer acquired through a deep discount may convert cleanly and never return. A buyer acquired through education, comparison content, or a strong product-fit page may convert more slowly and behave better after purchase.
This is where customer retention strategy becomes part of acquisition planning. Retention is not a later team. It is the proof that acquisition quality was real.
The second order is the hinge
The second purchase is where DTC math gets honest.
A first order proves that the brand can create enough interest for one transaction. A second order suggests the product, timing, support, and message created enough usefulness to keep the relationship alive.
BS&Co's repeat purchase benchmark studied 156,110 DTC customers across multiple categories and reported that 18.8 percent placed a second order within 365 days. Treat that as a directional benchmark, not a universal law.
Category, price point, replenishment cycle, seasonality, and first-product fit can all move the number.
The more useful lesson is the window. Eightx's purchase frequency benchmark reports that half of repeat buyers in its DTC dataset placed the second order within 30 days, and 76 percent did so within 90 days.
That makes the first three months after purchase an operating window, not a passive wait.
The work is not just "send more email." It is to understand why the customer should come back.
For replenishable products, the second-order path may be timing. For beauty, wellness-adjacent, food, beverage, and pet categories, consumption rhythm matters. For apparel, home, or higher-consideration goods, the second-order path may be fit, styling, support, gifting, or a complementary product.
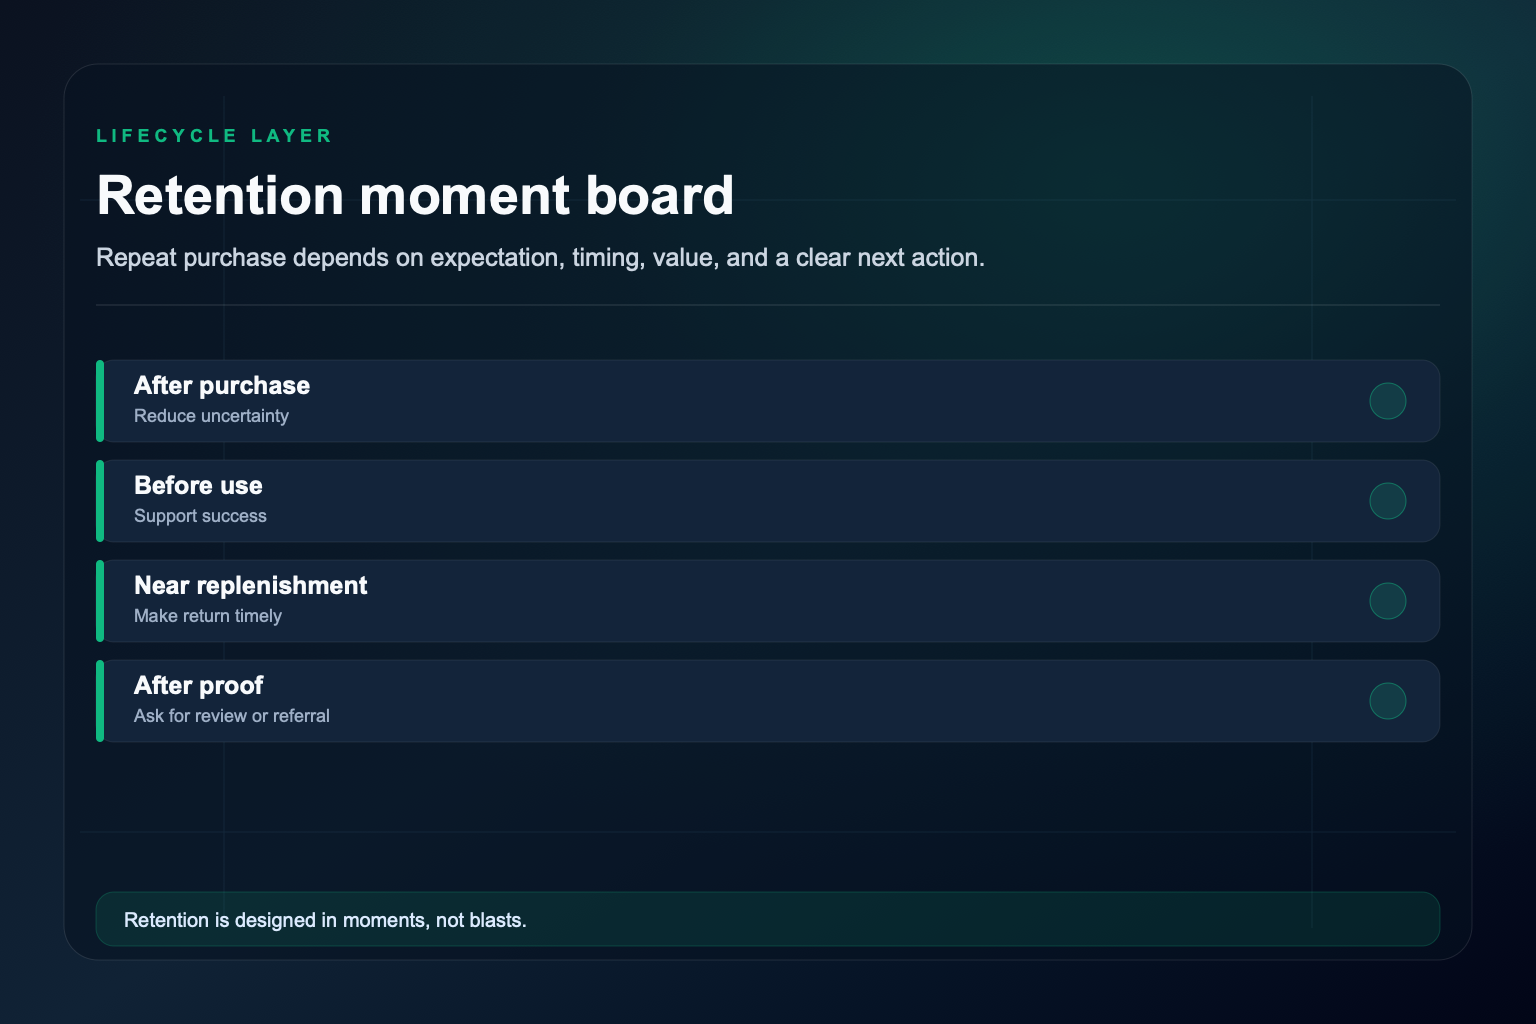
The second-order path should be planned around customer moments, not only a reminder calendar.
The mistake is building one retention calendar for every buyer.
Better questions:
- 1What did the customer buy first?
- 2What job did that product do?
- 3When would the product naturally need replacement, support, styling, or a companion?
- 4What proof would make the second purchase feel reasonable?
- 5What customer should be suppressed because the timing is wrong?
When those answers are missing, email and SMS become noise. When they are present, owned channels become margin protection.
Owned channels are the margin layer
Email and text-message programs are not magic. They are simply cheaper places to continue a real customer relationship once the customer has opted in.
That is why they matter so much when acquisition gets expensive.
Klaviyo's current benchmark program gives ecommerce teams a way to compare campaigns, flows, and industry performance. The important operating split is not open rate versus click rate. It is automated behavior-based revenue versus broadcast dependence.
A brand that depends almost entirely on weekly campaigns is usually reacting. A brand with strong welcome, post-purchase, replenishment, browse, cart, winback, and preference flows is building a retention system.
The email calendar should know:
- Which first products create the best second order
- Which customers need education before another offer
- Which products have natural replenishment timing
- Which discount buyers should not receive every promotion
- Which customers need service help before they need another campaign
That is messaging work as much as lifecycle work. The message after purchase should not sound like a generic promotion. It should reflect what the buyer just decided, what they may need next, and what would make a second order useful. Sparksbox breaks that down in digital marketing messaging strategy.
TikTok Shop is not a shortcut
TikTok Shop deserves attention, but it does not fix weak unit economics.
EMARKETER projected that TikTok Shop would make up nearly 20 percent of U.S. social commerce in 2025, while total U.S.
social commerce was expected to keep growing. That makes the channel hard to ignore for product categories that can sell through short-form proof, creator context, and fast customer trust.
It also makes the channel easy to misunderstand.
TikTok Shop is not just another product feed. It changes the sales environment. The buyer may discover, evaluate, and transact inside a content flow. That can compress attention, but it can also compress margin if the brand uses discounts, affiliate payouts, fulfillment incentives, and paid amplification without a clear payback model.
A DTC brand should ask:
- Does the product demonstrate well in short-form video?
- Does the creator or merchant explain the product better than the product page?
- Can fulfillment handle spikes without hurting reviews?
- Does the discount train bad customers?
- Does the brand capture enough customer relationship outside the platform?
If the answer is no, TikTok Shop may still create revenue. It may not create a durable customer base.
Trade rules changed the floor
Supply-side pressure belongs in the DTC conversation too.
The U.S. de minimis rule long allowed many low-value shipments to enter duty-free. U.S. Customs and Border Protection now states in its ecommerce FAQ that, effective August 29, 2025, duty-free treatment for low-value shipments valued at or under $800 is suspended from all countries that would otherwise qualify.
That change affects marketplaces, cross-border sellers, product pricing, landed cost, fulfillment timing, and competitive pressure. It does not automatically make domestic DTC easy. It does make cost structure more important.
Brands that rely on thin margins, slow shipping, unclear product differentiation, or discount-led acquisition may feel the pressure first. Brands with cleaner product positioning, better owned channels, and tighter operations have a better chance to turn the disruption into a relative advantage.
The point is not to chase tariff news every week. The point is to stop treating media efficiency as separate from operations.
Measurement has to triangulate
Platform reporting is useful. It is also partial.
Every ad platform wants credit for the sale. That does not make platform reporting useless, but it does mean the business needs a second and third view before making budget decisions.

The practical stack is triangulation:
- Platform reporting for fast directional feedback
- Analytics and ecommerce data for site and checkout behavior
- Cohort reporting for realized customer value
- Holdout or incrementality tests when spend is large enough
- Marketing mix modeling when the brand has enough history and channel complexity
Google's Meridian is an open-source marketing mix modeling framework built to help marketers measure campaign impact across channels. Meta's Robyn is an open-source marketing mix modeling package from Meta Marketing Science.
Neither removes judgment. Both are useful signs that better measurement is no longer reserved only for huge brands.
The goal is not to replace the media buyer with a model. The goal is to stop asking one biased report to answer every business question.
The Q4 move starts earlier
The best Q4 plan usually starts before Q4.
If auctions get more expensive during peak retail windows, the answer is not automatically to spend harder into the same auction. The better move is to use quieter periods to acquire the right customers, teach them why the product fits, earn the second order, and build owned-channel segments before holiday demand gets noisy.
That changes the calendar:
| Period | Job | Risk if skipped |
|---|---|---|
| Q1 and Q2 | Acquire customers with cleaner payback and test offer quality | Q4 spend has to do all the work |
| Q2 and Q3 | Build replenishment, education, and second-order paths | Holiday customers arrive cold |
| Early Q4 | Segment by prior behavior and margin | Promotions go to everyone |
| Peak Q4 | Use owned channels to protect margin and timing | Paid channels overclaim performance |
| Post-holiday | Measure cohort quality and support load | The team repeats the same play next year |
This is why campaign planning cadence matters. A brand cannot fix unit economics with a frantic calendar. It needs a rhythm that decides what the campaign is allowed to spend, what it has to prove, and what happens after the first purchase.
Make growth prove itself
DTC growth is not dead. Lazy DTC math is.
The healthier operating question is not whether the brand can create demand. It is whether the demand can survive after the first click, first order, first discount, and first platform report.
Make the channel prove the customer. Make the customer prove the product. Make the second order prove the economics.
Frequently asked questions
The main problem is that acquisition, retention, margin, and measurement are often managed separately. A brand can show strong first-order revenue and platform-reported return on ad spend while contribution margin, repeat purchase behavior, and cohort value are too weak to support more spend.
There is no universal healthy ratio because category, replenishment, margin, fulfillment cost, and repeat behavior vary. Many operators still use 3:1 as a directional target, but the better practice is to compare realized lifetime value by cohort against fully loaded acquisition cost and first-order contribution margin.
The second purchase is the first strong sign that the product, timing, message, and customer experience created real usefulness after the initial transaction. If the customer does not return within the natural product window, lifetime value assumptions can become optimistic very quickly.
TikTok Shop can be useful when the product demonstrates well in short-form content, the brand can manage fulfillment and customer service, and the economics still work after discounts, creator payouts, and paid amplification. It should be treated as a commerce and operations test, not only a media channel.
Use triangulation. Start with platform reporting for fast feedback, then compare it against analytics data, ecommerce cohorts, contribution margin, and holdout tests when budget allows. For larger or more complex programs, open-source marketing mix modeling tools such as Google Meridian or Meta Robyn can add another view.
Fix the conversion definition, first-order margin view, second-order path, owned-channel flows, source naming, and weekly review rhythm. More spend should make a working system bigger, not make a blurry system louder.